Where the market sits
The Puget Sound office market has stopped getting worse. That is the most useful thing to say about it as of August 2026. Our composite of the mid-year surveys puts regional vacancy in the 23-26% range for institutional-grade buildings, flat to slightly lower than the spring, with the first positive absorption for the year to date since 2022. Measured across the full inventory, including owner-occupied and smaller buildings, the figure is closer to 17%, which is why headline numbers vary so widely by publisher. Available space, the better leading indicator, has leveled off at roughly 40-42 million square feet and is drifting down.
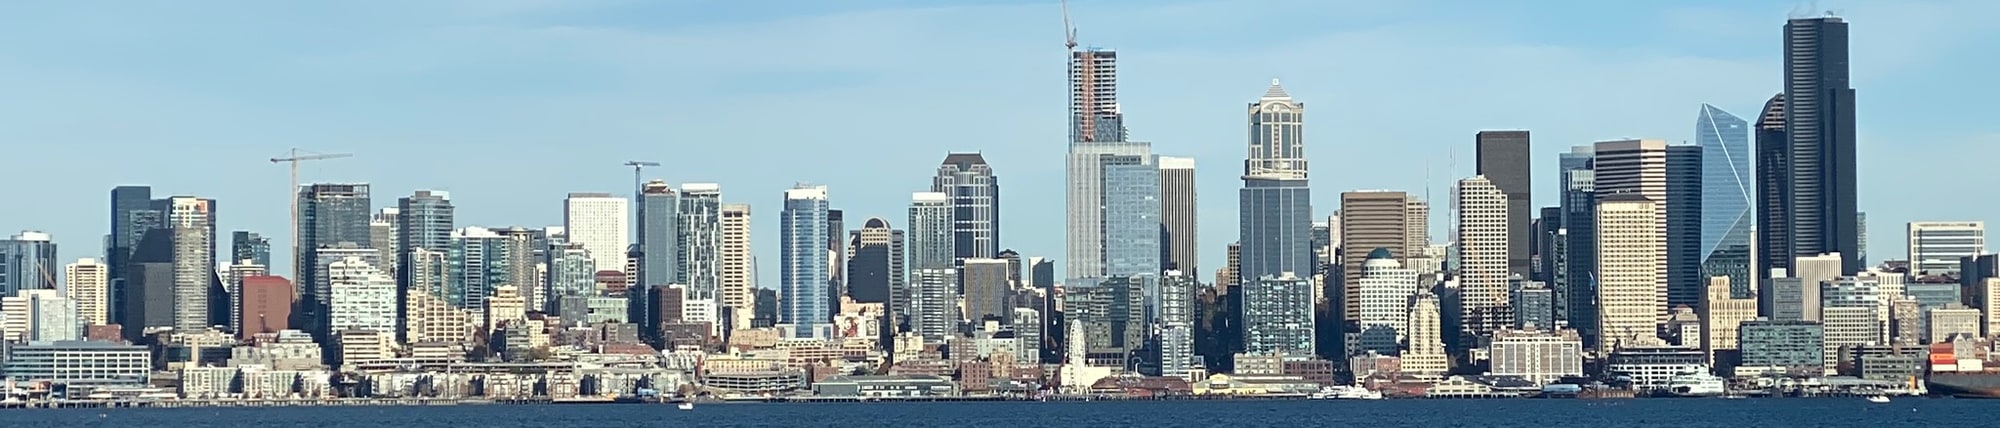
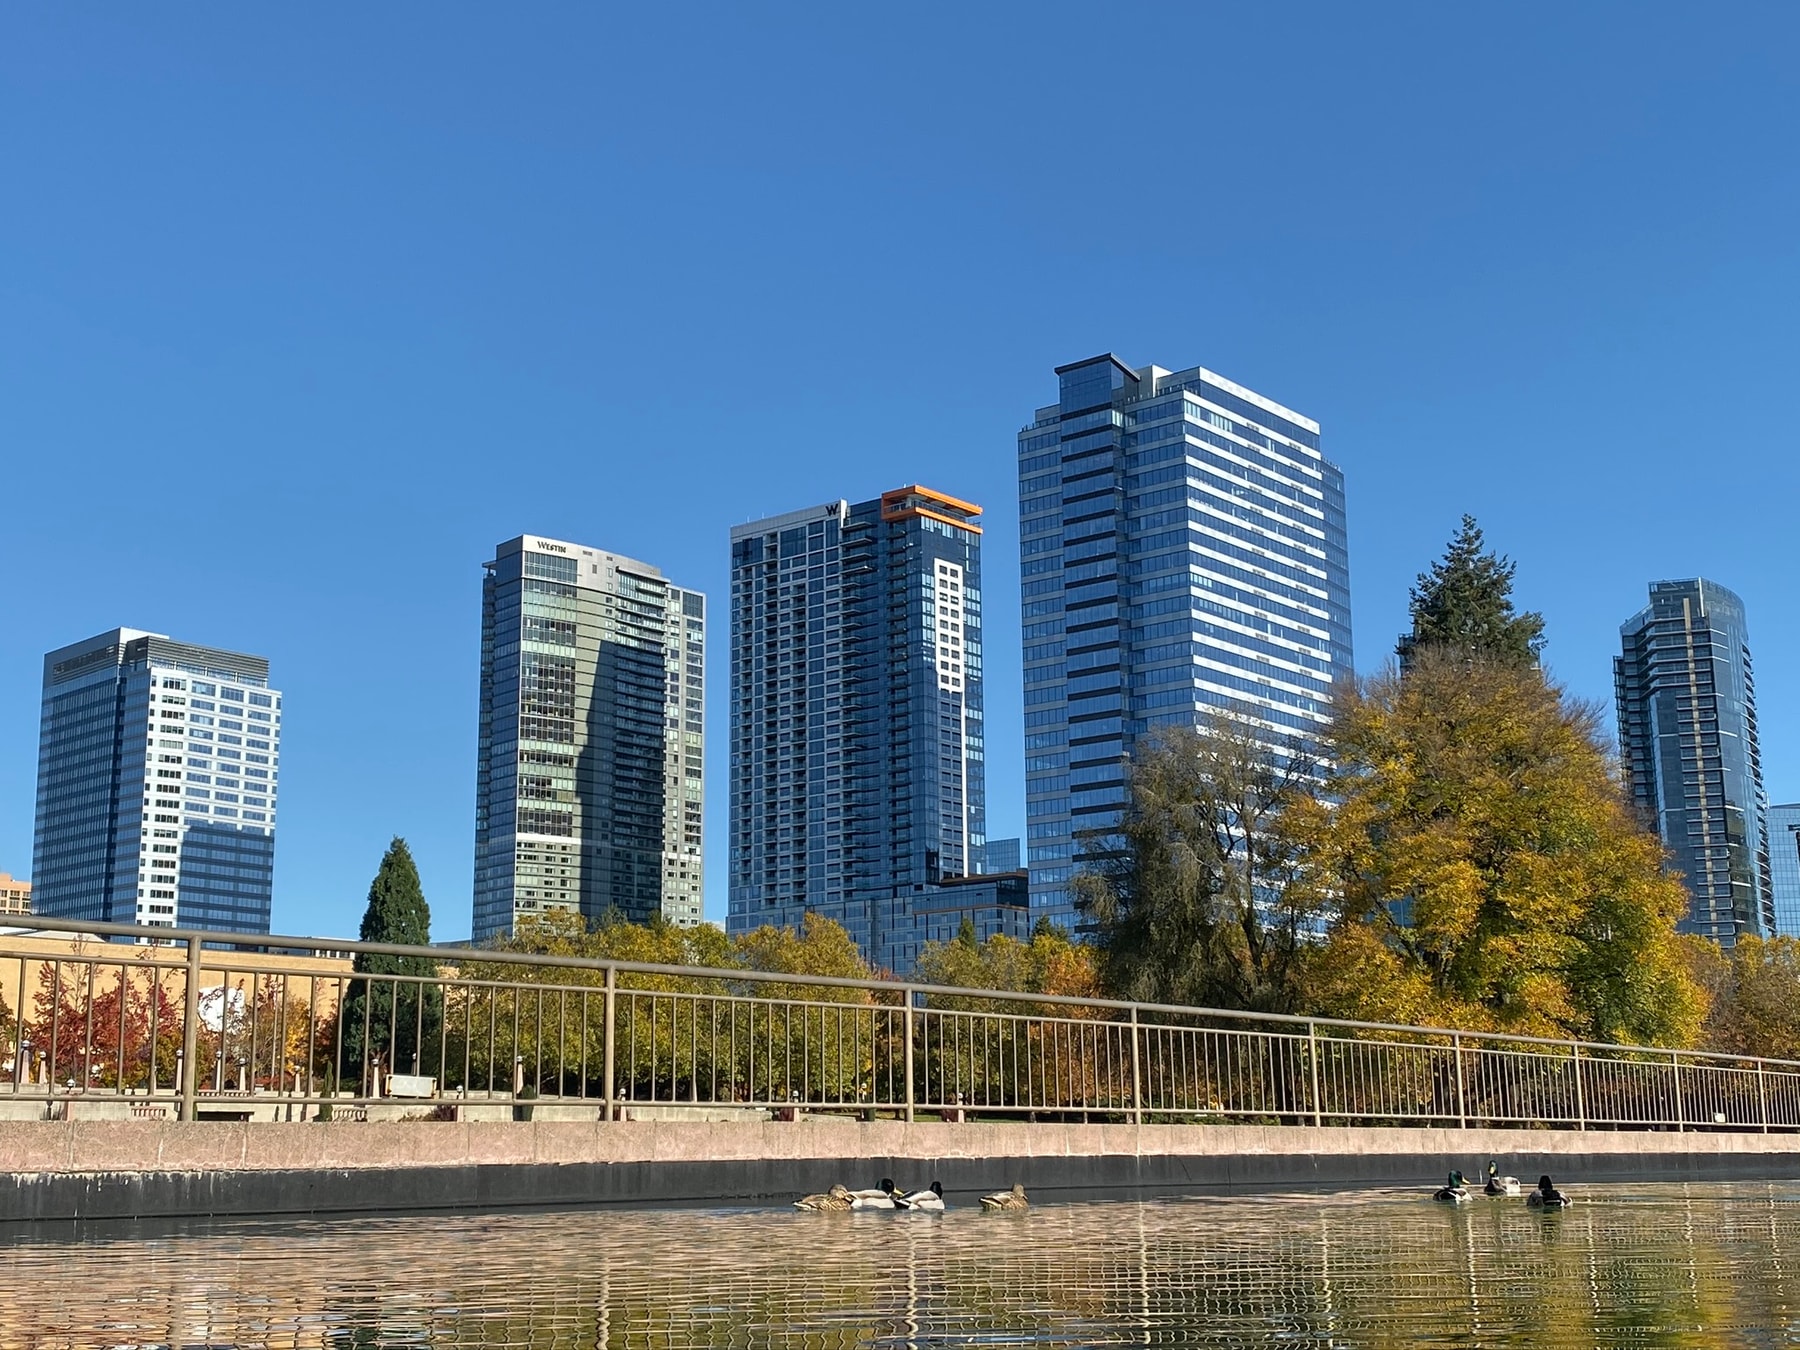
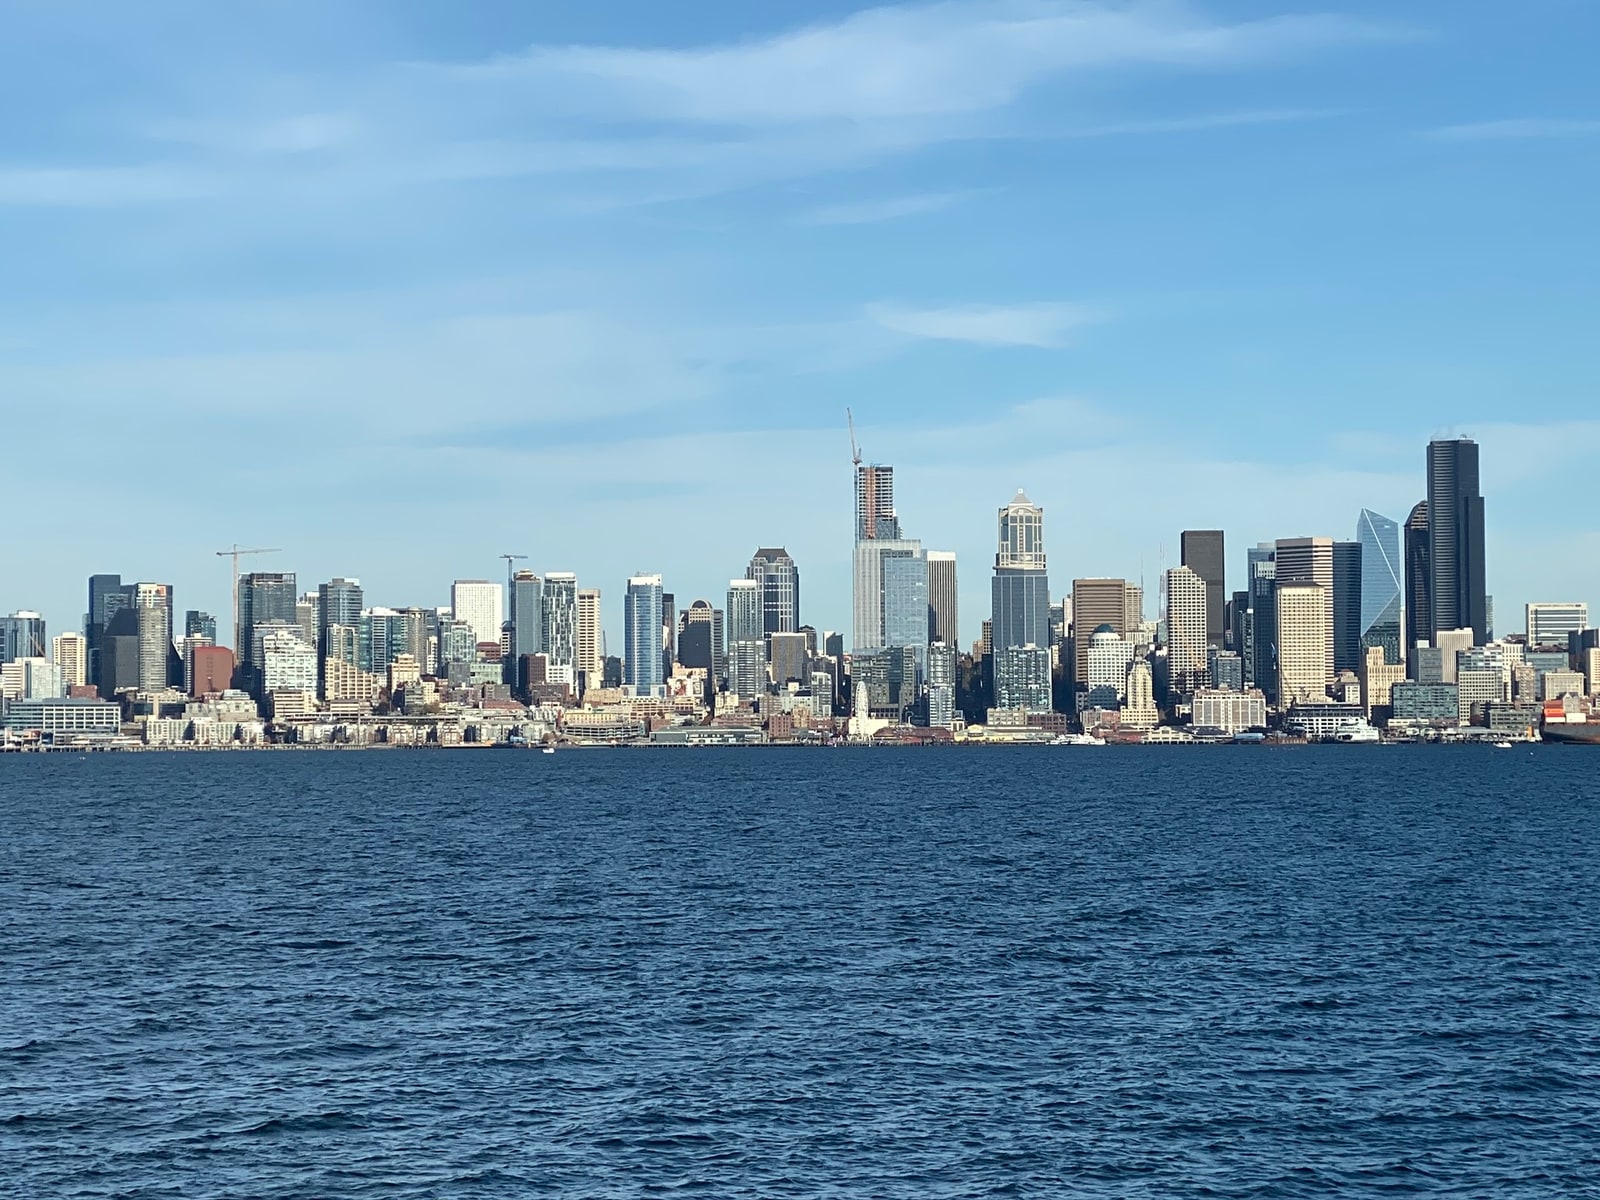
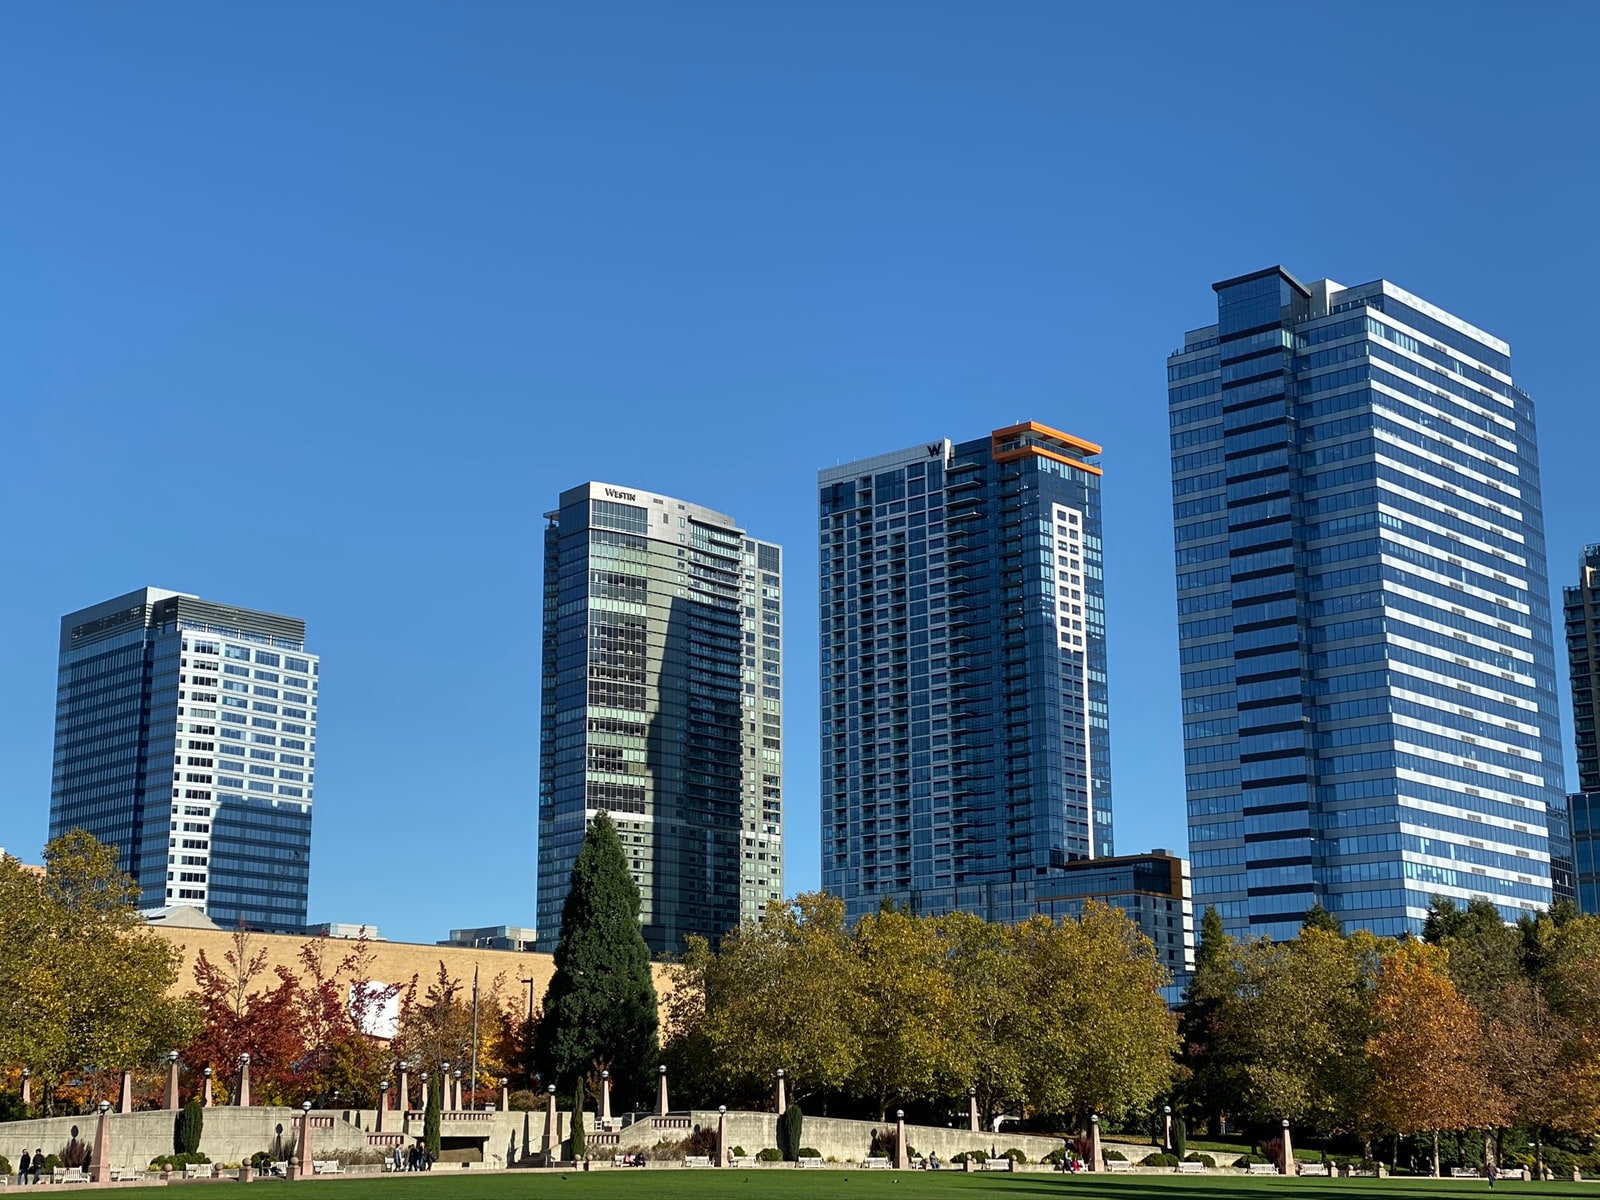
The regional number hides a wide split. Downtown Seattle vacancy sits in the 34-36% range. The Eastside runs near 21%, and Suburban Bellevue, with its medical office base, is in the low teens. The I-90 corridor remains the region's weakest pocket, with availability near 40%.
What is driving it
Leasing volume has returned even though headcount has not. First-half leasing across the region ran in the 3.5-4.5 million square foot range, the strongest first half since 2019, and Downtown Seattle's second-quarter volume rose more than 50% year over year. The commitments are concentrated in new or renovated buildings: a large AI-lab expansion at City Center Plaza and two technology tenants at Four106 in Bellevue, a new AI-lab lease at Dexter Yard, and law-firm and fintech backfills of former Amazon space at West8 downtown. The year's largest new lease is a health system taking two buildings at the former Boeing Longacres campus in Renton.
Supply is no longer a factor. Speculative construction is effectively zero; the 1-1.5 million square feet still underway is almost entirely Amazon's Bellevue 600 tower, against a 2022 peak above 11 million. Sublease space has fallen to roughly 12% of availability, the lowest share since 2018, while demolitions and residential conversions have started to remove older buildings on the Eastside and in Seattle.
Pricing and capital
Face rents are flat. The regional average asking rent sits in the low-to-mid $30s per square foot, down about 1% year over year, with Bellevue CBD in the mid-$50s on a blended basis and new Class A towers asking in the high $60s. Improvement allowances above $100 per square foot on first-generation space and roughly a month of free rent per lease year mean effective rents remain well below asking.
Investment sales remain thin. Trailing twelve-month volume is near $1 billion against a five-year average of roughly $2.5 billion, with average cap rates around 7% and pricing near $325 per square foot. The Eastside took close to two-thirds of regional volume last year. Owner-users made up about a fifth of buyers, and a growing share of trades are land plays for demolition or conversion.
What this means for owners
For a family holding office, the question is no longer whether the floor has been reached but which side of the quality line the building sits on. Newer Bellevue product is leasing and can hold face rent; older commodity space in Downtown Seattle and along I-90 competes on concessions or on land value. We expect the next two years to reward owners who decide early between reinvesting to compete for the current tenant pool, holding for income with a realistic concession budget, or pricing the asset for a conversion or owner-user buyer. Waiting for the 2019 market to return is the one option the data does not support.
CMRE Partners analysis of its own data and experience, publicly available market research from national and regional sources, together with public data from the Port of Seattle, the Downtown Seattle Association, and Washington State agencies. Figures are CMRE Partners' composite ranges as of August 2026. General information only. Please contact CMRE Partners to discuss a specific matter.